SOC metrics that matter for smaller teams
Most SOC dashboards measure activity, not outcomes. For a lean team, a few SOC metrics — MTTD, MTTR, dwell time, false-positive rate — beat a wall of numbers.

- SOC metrics measure how well your security operations actually work — the speed of detection and response, the level of alert noise, and how much of your environment is covered.
- For a smaller team, fewer is better: a handful of outcome metrics (MTTD, MTTR, dwell time, false-positive rate) beats a dashboard full of vanity counts.
- Track trends over time against your own baseline, not absolute numbers against someone else's.
In this article
- What are SOC metrics?
- Operational vs. strategic metrics
- The core time-based metrics
- Quality metrics: noise and misses
- Coverage: what you can actually see
- The core metrics at a glance
- The vanity metrics to ignore
- Who reads which metric
- Why lean teams track less
- How to read them: trends, not trophies
- The role of AI and automation
- In-house vs. through a managed SOC
- How Mahoney Control surfaces SOC metrics
- Frequently asked questions
“You can’t improve what you don’t measure” is true — but measuring everything is its own trap. Plenty of teams have a dashboard with forty widgets and still can’t answer the only question that matters: are we catching real threats before they can do damage? For a smaller team especially, the goal isn’t more numbers. It’s the few that tell you whether your security is actually working.
This guide covers the SOC metrics that matter, how to group them, the vanity numbers to ignore, and how a lean team should read them.
What are SOC metrics?
SOC metrics are the key performance indicators (KPIs) for a security operations center — the numbers that show how effectively you detect, triage, and respond to threats. The good ones measure outcomes: did we catch it, how long it took, and how cleanly? The weak ones just count activity.
That distinction is the whole game. A metric is only useful if it changes a decision. Most of these numbers come built into a managed SOC, which measures and reports them as part of the service rather than leaving you to assemble them by hand.
Operational vs. strategic metrics
Before the list, one useful split. SOC metrics fall into two groups, and confusing them is why so many dashboards sprawl:
- Operational metrics answer “how is the team performing day to day?” — detection speed, response speed, alert noise, analyst load. These drive tuning and staffing.
- Strategic metrics answer “is our security posture improving over time?” — coverage, trend in dwell time, risk reduction. These are what you take to leadership.
A smaller team needs a few of each: enough operational signal to run the week, enough strategic signal to show progress.
The core time-based metrics
If you track nothing else, track these. Together they describe how long an attacker has to work before you catch and stop them.
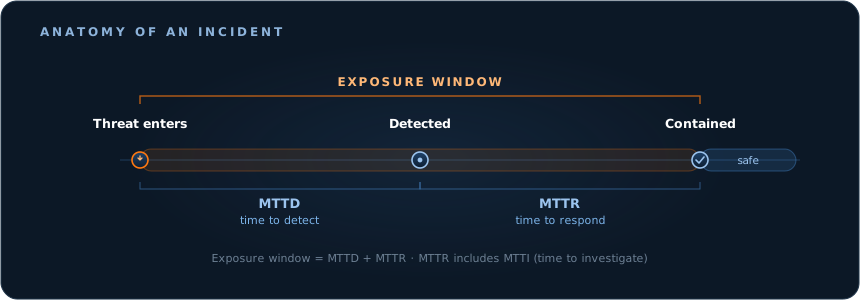
- MTTD — mean time to detect. How long a threat is active before anyone notices it. It reflects the quality of your threat detection.
- MTTI — mean time to investigate. How long it takes to work out whether a detection is a real incident once it’s flagged.
- MTTR — mean time to respond. How long from detection to containment.
- Dwell time. The total span an attacker spends in your environment before being evicted — the number attackers count on being large, and the one a good SOC drives down.
MTTD and MTTR together define your exposure window — the gap between a threat arriving and being contained, which is essentially the dwell time you can control. Shrinking that window is the single clearest sign a SOC is getting better.
Quality metrics: noise and misses
Speed means nothing if you’re chasing ghosts or missing the real thing. (False positives and false negatives are defined in the triage guide; as metrics, what counts is the rate.)
- False-positive rate (signal-to-noise). How much of what the team chases turns out to be nothing — a leading indicator of alert fatigue and, eventually, missed threats.
- False-negative rate. The share of real threats that slipped through unflagged. Hard to measure, and the most important to drive toward zero.
- Escalation accuracy. Of the alerts escalated as real, how many genuinely were — it keeps both over- and under-reacting honest.
Coverage: what you can actually see
You can’t detect what you don’t monitor. Coverage measures how much of your environment is in view — endpoints, servers, cloud, identity — and how many attacker techniques you can catch, often by mapping detections to MITRE ATT&CK, a public knowledge base of how attackers operate. A fast MTTD over half your estate is a false comfort; coverage is what makes the other metrics trustworthy.
The core metrics at a glance
| Metric | What it measures | Better is |
|---|---|---|
| MTTD | Time from intrusion to detection | Lower |
| MTTR | Time from detection to containment | Lower |
| Dwell time | Total time an attacker is present | Lower |
| False-positive rate | Share of alerts that are noise | Lower |
| Coverage | How much you can see and catch | Higher |
The vanity metrics to ignore
Just as telling is what to leave off the dashboard. These look impressive and mean little:
- Total alerts generated. A bigger number isn’t better security — usually the opposite. It measures noise, not protection.
- “Threats blocked” counts. Most are automated, low-value, and uncontextualized; the figure is marketing, not insight.
- Number of tools deployed. Protection comes from what you can see and act on, not how many consoles you own.
The pattern: vanity metrics measure activity; the metrics that matter measure results. When a number can only go up and never prompts a decision, it’s decoration.
Who reads which metric
Different audiences need different numbers, and a common mistake is showing everyone the same wall of data.
- Front-line (L1) analysts live in operational metrics: alert volume, false-positive rate, what’s in the queue right now.
- Senior (L2/L3) analysts and leads watch MTTD, MTTI, MTTR, and escalation accuracy to tune detection and process.
- Leadership and the board want the strategic view: dwell-time trend, coverage, and whether the exposure window is shrinking — not raw alert counts.
For a small team wearing several of these hats at once, that’s an argument for fewer, clearer metrics, not more.
Why lean teams track less
A large enterprise SOC can staff metric reviews and slice data a hundred ways. A lean team can’t — and shouldn’t try. Five outcome metrics you actually act on beat a dashboard full you only skim.
The discipline is subtraction: pick the few that would change what you do this week, put them where everyone sees them, and ignore the rest.
How to read them: trends, not trophies
A single number out of context means little. Is an MTTD of a few hours good or bad? It depends entirely on where you started and where you’re heading. The value is in the trend:
- Are MTTD and dwell time falling over successive months?
- Is signal-to-noise improving as detection rules get tuned?
- Is coverage expanding as you onboard new systems?
Benchmark against your own past, not a vendor’s headline figure. Published “industry averages” vary wildly by sector and size; steady improvement on a handful of honest metrics is worth more than a perfect-looking snapshot borrowed from someone else.
The role of AI and automation
Automation is what lets a small team move these numbers without adding headcount. Auto-enrichment and correlation cut MTTI; automated containment cuts MTTR; tuning and deduplication cut the false-positive rate. AI-assisted triage handles the first pass at sorting noise from signal, so the metrics improve because humans spend their time only where judgment is needed — not because anyone worked longer hours.
In-house vs. through a managed SOC
Producing these metrics in-house takes the tooling to capture them and the time to maintain the reporting — on top of the detection and response work itself. For most smaller teams that’s why the metrics come as part of a managed SOC, measured and reported continuously rather than assembled by hand each quarter.
How Mahoney Control surfaces SOC metrics
Numbers are only useful if you trust them and can act on them. Mahoney Control — by Mahoney IT — puts these metrics on a single surface, each one tied to the underlying evidence, so you can drill from a trend straight to the alerts and incidents behind it — metrics you can act on, not just admire.
See how this works on our Security Operations page.
Frequently asked questions
What are the most important SOC metrics? For most teams: mean time to detect (MTTD), mean time to respond (MTTR), dwell time, false-positive rate (signal-to-noise), and coverage. Together they show how quickly and cleanly you catch and contain threats.
What do MTTD, MTTI, and MTTR mean? Mean time to detect (how long until a threat is noticed), mean time to investigate (how long to confirm whether it’s real), and mean time to respond (how long to contain it once detected). All three should trend down over time.
What is dwell time? The total time an attacker is present in your environment before being removed. Lower dwell time means less opportunity to do damage.
Are SOC metrics the same as SOC 1, SOC 2, and SOC 3 reports? No — same three letters, different meaning. SOC metrics are the KPIs of a security operations center. SOC 1/2/3 are independent auditing reports about how a company handles data and controls. This article is about the security operations center.
What is the difference between L1, L2, and L3 SOC analysts? Roughly: L1 triages incoming alerts, L2 investigates the ones that look real, and L3 handles deep analysis, threat hunting, and the hardest incidents. Which metrics matter depends on which tier — and on a small team, one person often covers all three.
Which SOC metrics should a small team track? Start with the handful of outcome metrics above and watch their trends. Resist adding vanity counts (total alerts, “threats blocked”) that look impressive but don’t change a decision.
If you’d like to see which metrics would tell the clearest story for your organization, request a no-obligation security assessment.