How to calculate the cost of a security incident, line by line
A security incident has no price tag until someone builds one. How MSPs and MSSPs can calculate its cost from the client's own numbers, line by line.
- The cost of a security incident is a sum of line items the client can check: downtime, response effort, outside specialists, recovery, notification, and contract consequences.
- Revenue overstates the cost of downtime. Start from the margin that was lost for good and the work that stopped, and count nobody twice.
- One average can hide very different incidents, so state which ones it includes, and label anything estimated as modeled.
In this article
- What belongs in the cost of a security incident
- The formula, with a worked example
- Downtime is where estimates go wrong
- One average can hide three kinds of event
- Mostly counted afterward, modeled beforehand
- What to keep out of the total
- Why a breach cost calculator falls short
- Update the worksheet after every incident
- Where the Financials module of Mahoney Control fits
- Frequently asked questions
Ask a client what a security incident would cost them and you usually get one of two answers. A shrug, or a number from a headline about a company ten times their size. Neither helps when the owner has to decide whether a proposed control is worth its price.
The client’s own figure can be worked out. Nobody has built it yet, because it sits in pieces: part of it in payroll, part in old invoices, part in the head of the person who knows what a lost day of orders means. Your job is to put those pieces on one page.
This article is for managed service providers (MSPs) and managed security service providers (MSSPs). It shows how to calculate the cost of a security incident from a client’s own numbers, how to turn several incidents into an average worth using, why one average can hide very different incidents, and what to keep out of the total. Once you have the number, our guide on how to show clients the value of cybersecurity covers how to present it.
What belongs in the cost of a security incident
An incident costs money in six places. Each has a record or a person behind it that can give you a figure, which means you rarely have to guess alone.
| Line item | What it covers | Where the number comes from |
|---|---|---|
| Downtime | Sales and work that stopped while systems were out | The client’s finance lead, outage records |
| Response effort | Internal staff hours, plus provider hours outside the agreed scope | Time records, tickets |
| Outside specialists | Forensic investigators, incident response firms | Invoices |
| Recovery | Restoring from backup, rebuilding devices, replacing hardware, re-entering lost data | Invoices, time records |
| Notification and regulatory | Counsel’s review, telling affected people, credit monitoring, regulator inquiries, fines | Counsel, invoices |
| Contract consequences | Service credits or penalties owed to the client’s own customers | Customer contracts |
Not every incident touches all six. A contained malware infection on one laptop may stop at response effort. A data breach can reach every row. Whether notification duties or fines apply in a given case is a question for the client’s counsel. If money went straight to an attacker or a fraudster, as a ransom or a fraudulent wire transfer, show it as a separate line next to the six and state whether the total includes it. Whether to pay a ransom is a decision for the client, with their counsel and, where the insurance policy calls for it, their insurer.
The formula, with a worked example
The methodology is plain addition:
Incident cost = downtime + response effort + outside specialists + recovery + notification and regulatory + contract consequences
Here is a hypothetical example, for illustration only, laid out as a worksheet you can reuse. A compromised account takes a client’s order system offline for six hours.
| Line item | Calculation | Amount |
|---|---|---|
| Downtime | 6 hours at $1,200 per hour | $7,200 |
| Response effort: internal | 20 hours at $60 per hour | $1,200 |
| Response effort: provider, outside scope | 16 hours at $150 per hour | $2,400 |
| Outside specialists: forensics | Fixed fee | $8,000 |
| Recovery | Rebuilds and restore testing | $1,500 |
| Notification and regulatory | Invoiced | $4,000 |
| Contract consequences | None in this case | $0 |
| Subtotal: invoices and time records | $17,100 | |
| Subtotal: estimated downtime | $7,200 | |
| Total (modeled) | $24,300 |
The rows backed by invoices and time records add up to $17,100, and the estimated downtime row is $7,200. Show both subtotals above the total, and label the $24,300 as modeled, meaning it rests partly on an estimate. When an incident’s worksheet goes into a client report, keep the subtotals with its total, so nobody reads that total as one blended number.
Every row can be checked by hand, and any single one can be challenged without losing the rest. A finance lead who disputes the hourly downtime rate is doing you a favor: from then on, the total is partly theirs.
Downtime is where estimates go wrong
Many inflated incident figures share one mistake. They take annual revenue, divide it by working hours, and call the result the cost of an hour offline.
Revenue overstates the loss for two reasons. Part of it was never profit, because goods and services cost money to deliver. And part of it comes back: a customer who couldn’t order at 10 a.m. often orders at 4 p.m. Build the hourly rate from these questions instead:
- What stopped, and for whom? An outage that hits one department is not a company-wide hour. If 40 percent of the work stopped, use 40 percent of the rate.
- What was lost for good? Count the margin (what is left of a sale after the direct cost of delivering it) on sales that never returned. Sales that were only delayed don’t belong here.
- Who was paid to wait? Staff whose work isn’t tied directly to sales still cost money while they can’t work. Count their idle payroll if the work was simply lost. If it was made up later, count the overtime instead. If you count both, you price the same hours twice.
Two more overlaps are easy to miss. If you already counted the lost margin on a sales team’s work, don’t add their idle payroll on top. And hours someone spent on the incident or the recovery belong in the response effort and recovery rows, not in idle time or overtime. In the example above, the $1,200 hourly rate could be $900 of lost margin on orders plus $300 of idle back-office payroll per hour, with no person in both figures.
The rate also moves with timing and length. A Monday-morning hour rarely costs what a Sunday-night hour costs, and a customer who waits six hours may not wait six days. For longer outages, price by the day and assume less comes back.
Duration is the other half of the multiplication. How long an outage runs depends heavily on how early the incident is detected and how fast it is resolved, which is why detection and resolution times belong in the same conversation. Our article on SOC metrics that matter covers which ones are worth tracking.
One average can hide three kinds of event
One incident gives you a figure. A client’s budget conversation needs an average, and this is where a sound calculation can still mislead.
Staying with hypothetical numbers, say a client has ten incidents on record: seven minor ones at $2,000 each, two serious ones at $24,300 each, and one major event at $120,000. From those same ten incidents you can honestly state three different averages:
- All ten: $182,600 divided by 10, or $18,260.
- Without the major event: $62,600 divided by 9, or about $6,960.
- Serious and major only: $168,600 divided by 3, or $56,200.
Each of these answers a different question. So state which one you used and which incidents it includes.
Small incidents pull an average down, and one major incident pulls it up. Dropping the small ones removes only the first effect: the major incident still drives the third average. The median of the three incidents in that average, the middle value, is $24,300, and the gap to $56,200 shows how far the largest one pulls the average. Put the incident count and the range, $24,300 to $120,000, right next to the $56,200.
Many smaller clients have no incident history at all. That is no reason to borrow someone else’s. Walk through one realistic scenario together, row by row, using the worksheet above. The result is a modeled estimate, and it carries the client’s own assumptions.
Mostly counted afterward, modeled beforehand
After a closed incident, most of these lines can be counted. The invoices exist, the time records exist, and the outage has a start and an end. The hourly downtime rate usually remains an estimate, which is why the $24,300 total in the worked example carries the modeled label even though every other row is counted.
Before an incident, every line is modeled. The average you carry forward is an assumption about the future, even when it was built from real history. Label it that way. The same applies to anything calculated from it: if an estimated input goes into a figure, the figure is modeled too. We explain why that separation matters to a client’s finance team in our guide to showing the value of cybersecurity.
What to keep out of the total
Some items stay out of the sum. Most are real but can’t be priced with any confidence, and adding them turns a figure the client can check into one they have to believe.
- Reputation and lost future customers. These can matter more than everything else on the page. Nobody can state them to the dollar, so name them below the total, unpriced.
- Higher insurance premiums. Note the possibility, and leave the pricing to the client’s broker.
- Insurance payouts. Show the gross cost first. Whether cyber insurance would cover a given loss depends on the policy, so don’t subtract a payout nobody has confirmed. If you show a net figure, show it next to the gross one, and name the retention, the part of a covered loss the client bears before the policy pays.
- Management attention. The owner’s lost week is a real cost and a poor line item. Mention it in words.
- Improvements made afterward. New controls bought because of the incident are an investment, so list them separately.
A short list of what you left out, right under the total, tells the client you counted only what you could support.
Why a breach cost calculator falls short
Search for this topic and you will find a page of calculators and data breach cost reports. They have their uses. A breach cost calculator can start a conversation, and a report on the cost of a data breach can give a rough sense of scale.
An industry average describes other companies, often much larger ones. A calculator estimates from a few inputs and general assumptions, usually about records and industries, and knows nothing about this client’s margins, contracts, or backup quality.
Use outside figures as a sanity check on the order of magnitude. If one ends up in a document, name the primary source and keep it out of the sum.
Update the worksheet after every incident
An incident cost built once and filed away goes stale as payroll, margins, and contracts change. A light routine keeps it usable:
- Fill in the worksheet after every closed incident, while the invoices and time records are easy to find.
- Record the duration and the scope, because those drive the downtime row.
- Review the hourly rates with finance once a year, or when the business changes.
- Revisit the average in a regular client review, and note which incidents it includes.
One caution for your own side: a completed worksheet for an incident in an environment you manage can surface in a dispute over who owes what. Check your own agreement, and ask counsel before you circulate the worksheet.
The payoff comes when a decision is on the table. A client weighing a new control can set its price against a number they helped build. That is also the most defensible way to recommend additional security services: the finding comes from their environment, and so does the cost it is weighed against.
Where the Financials module of Mahoney Control fits
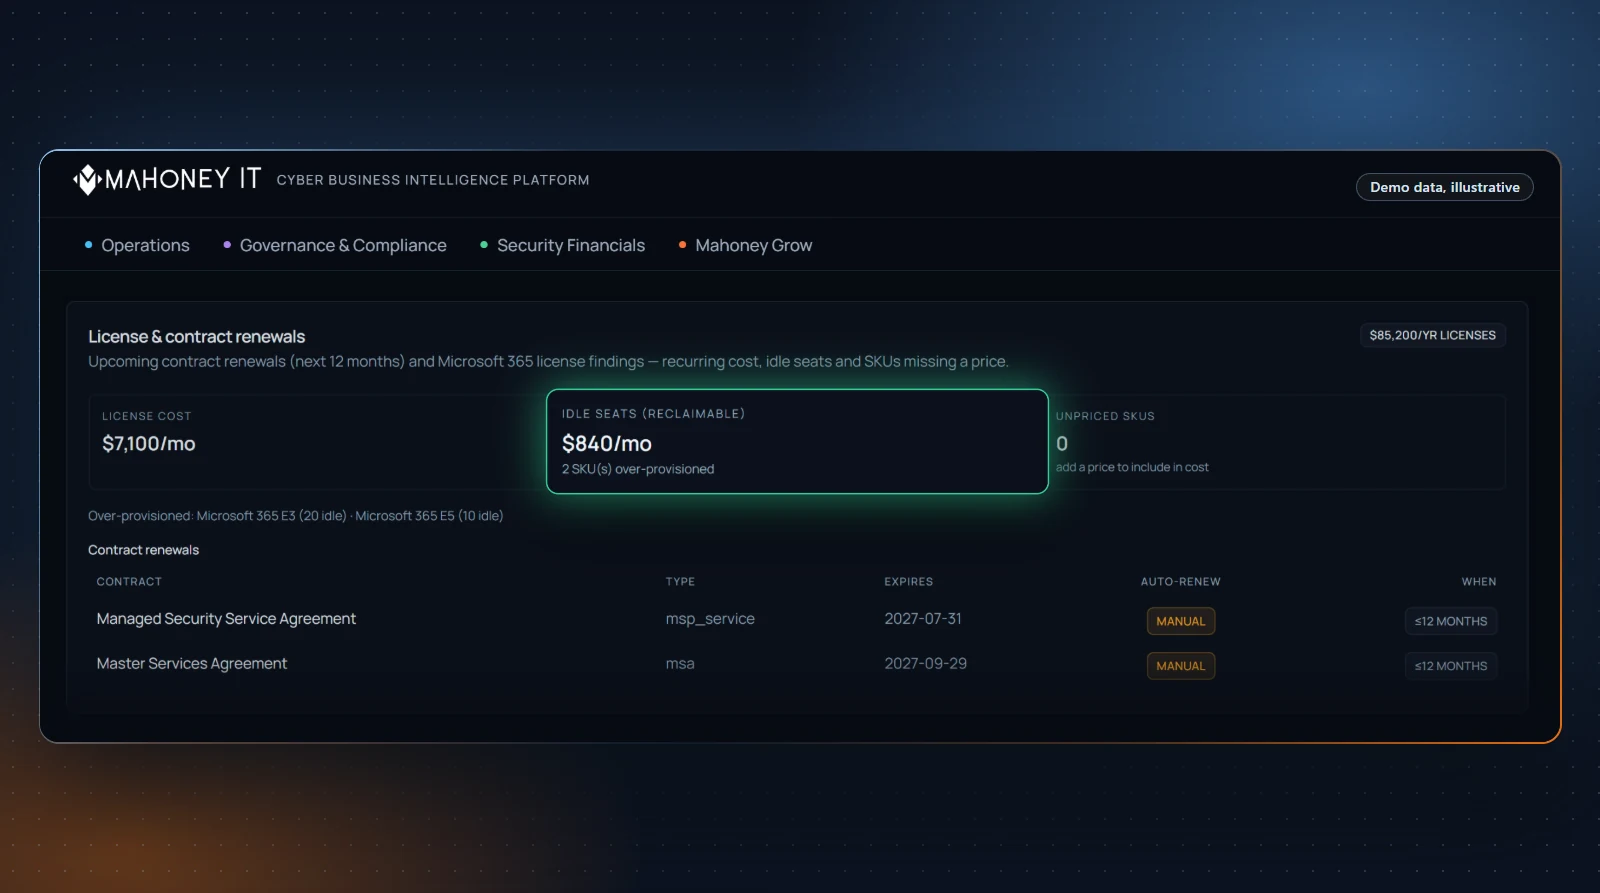
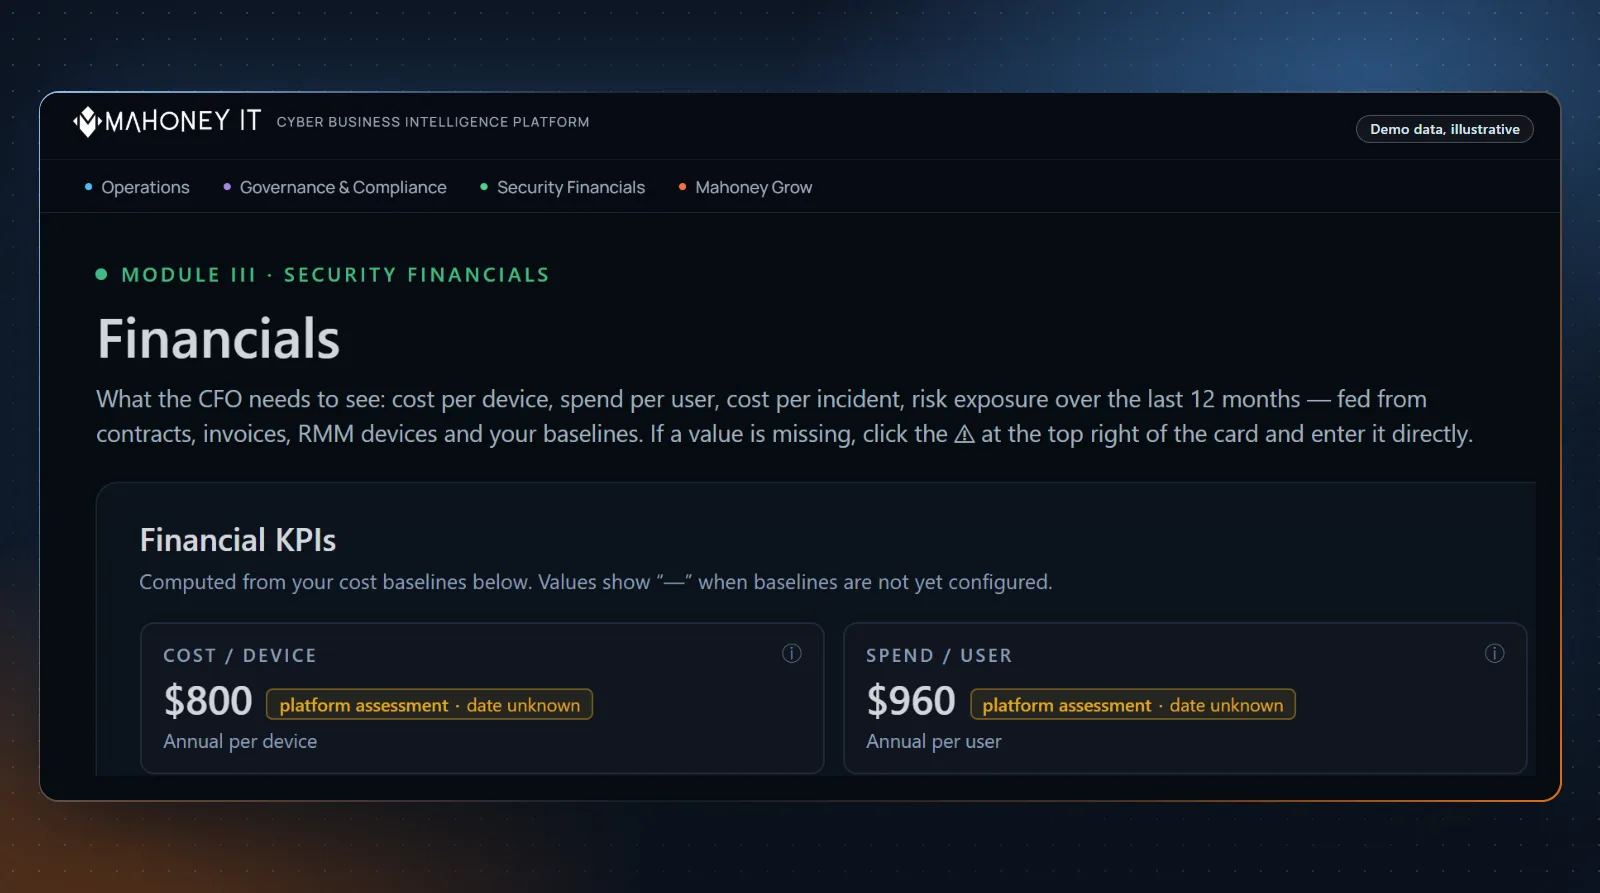
You can run this worksheet in any spreadsheet. We built the Financials module of Mahoney Control so the average from that worksheet sits with a client’s other security figures and feeds the risk exposure calculation.
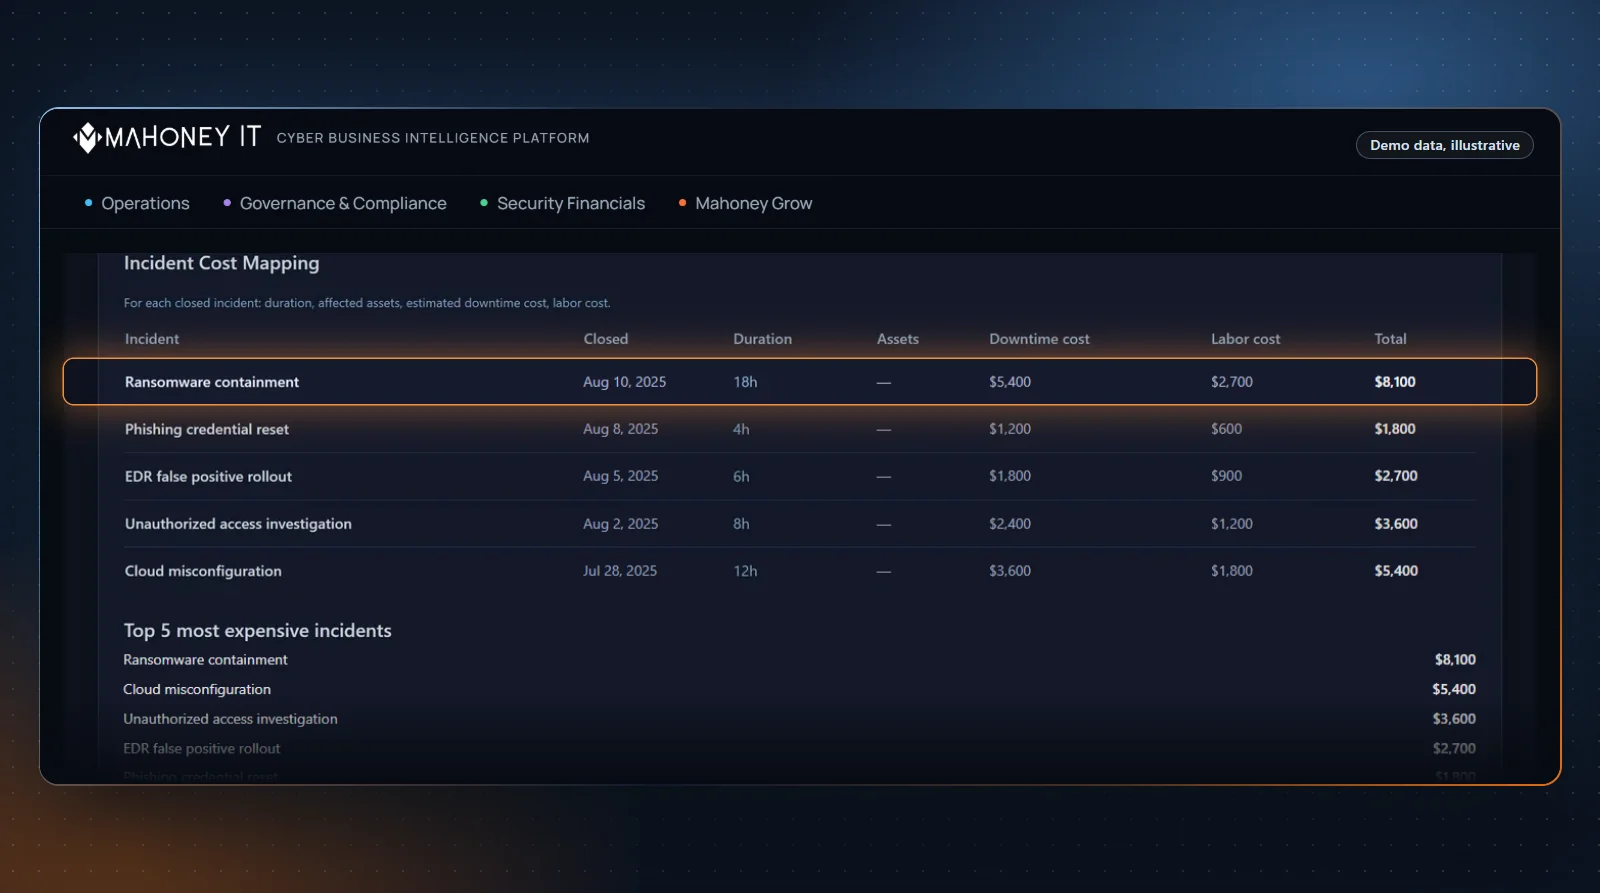
In the module, cost per incident is the average set for each client’s environment, so agree on it with the client first. Incident Cost Mapping can attach estimated dollar values to recent closed incidents, broken down by downtime cost and labor cost. Each of the two costs is the time between a detection event and a resolution event multiplied by its own hourly rate, and that time isn’t the same as the length of an outage. On a flat retainer, closed incidents show as included instead of priced.
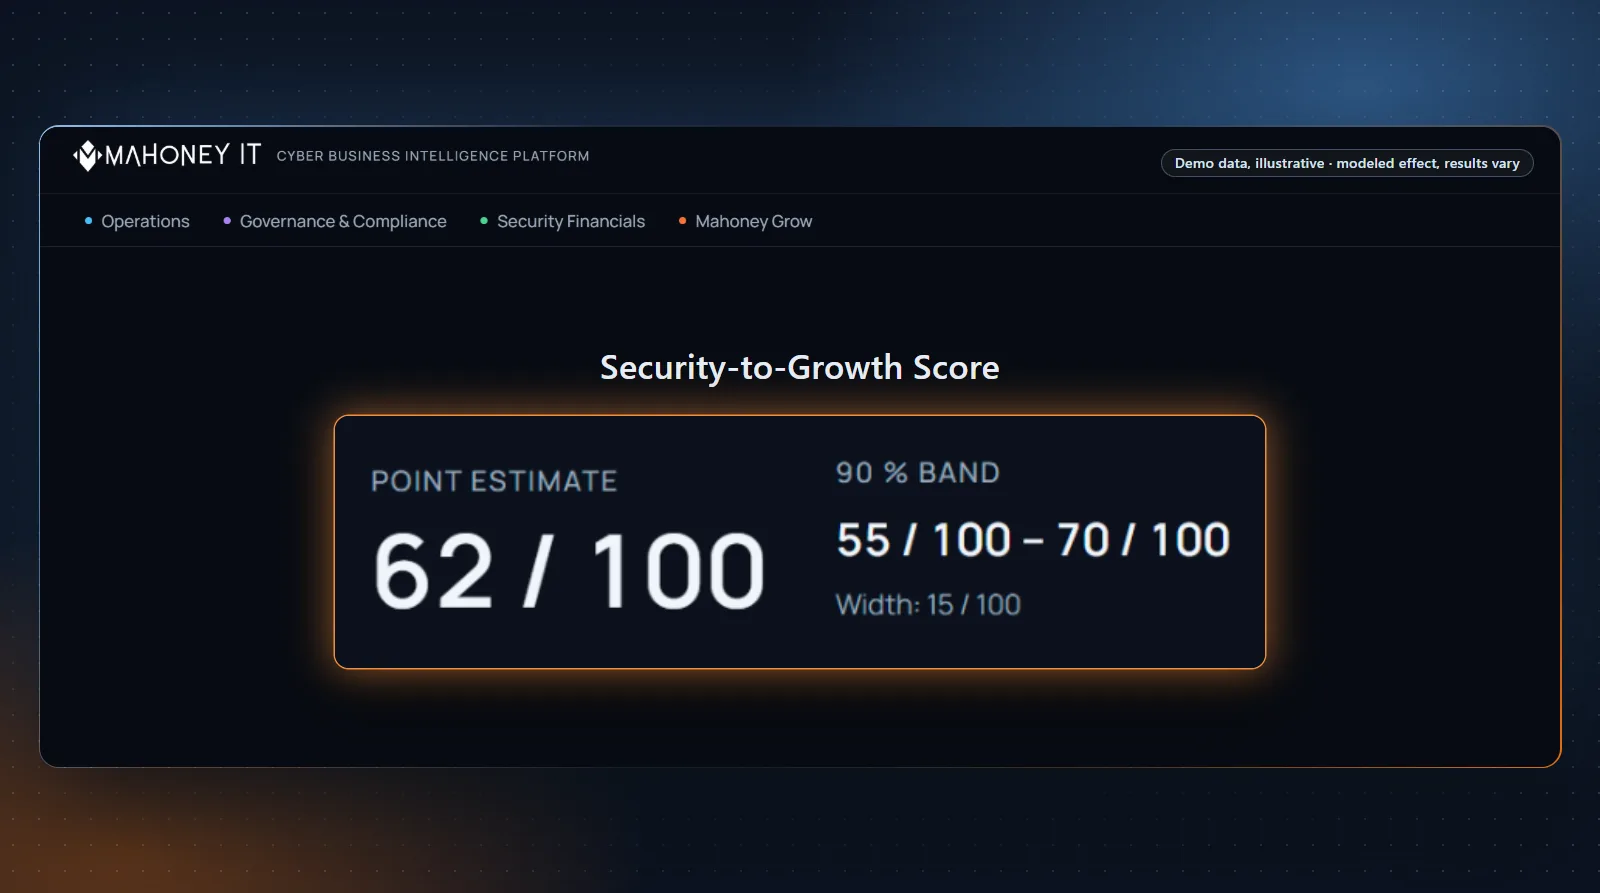
Risk exposure uses one simple formula: that average times the number of error and critical events the platform recorded over the last 12 months. The result is modeled: an estimate, not a measured loss and not an expected loss. It assumes every counted event became a full incident at the average cost. The count goes by the severity stored with each event. Tickets from ticketing (PSA) systems and billing events don’t count. Alerts from monitoring tools count by their stored severity, even when they aren’t about security, and security alerts stored at a lower severity are left out. A recently connected environment has fewer months behind the count. The figure can run high or low, so don’t present it as a maximum. The result is advisory.
A CSV export gives the client’s finance team the monthly spend entered, the device and user counts, the average cost per incident, the cost per protected device, the spend per user, and the risk exposure for the last 12 months in a format they can open. The file doesn’t mark the risk exposure as modeled, so label it that way when you pass it on.
The judgment stays with you and the client. Before a figure goes in front of anyone, confirm the downtime and labor rates behind it, and replace the platform defaults with the rates you agreed on. The default downtime rate is a rough platform estimate, not the client’s number. Incident Cost Mapping has no line for items like legal fees or contract penalties, so keep them in your worksheet.
Mahoney Control is multi-tenant, with strict tenant isolation per client. Availability of the Financials module depends on the plan; see pricing for details. You can read more on our Financials overview. If you’d like to see how incident costs would look for the clients in your own portfolio, request a no-obligation consultation.
Frequently asked questions
How do you calculate the cost of a security incident? Add up six line items: downtime, response effort, outside specialists, recovery, notification and regulatory costs, and contract consequences. Use the client’s own figures for each one: payroll and margin data, time records, and invoices. Keep every row visible so the client’s finance team can recompute the total and challenge any single assumption without discarding the rest.
How do you estimate the cost of downtime? Start with what stopped and for whom, then count the margin on sales that never came back, plus either the idle payroll of staff whose work was lost or the overtime spent making it up, never both. Don’t use revenue divided by working hours, because part of that revenue was never profit and part of it returns once systems are back. Make sure no person is counted in both the margin and the payroll figure.
What is a realistic average cost per incident for a small business? There is no figure that holds across businesses, because margins, contracts, and recovery options differ too much. Build the average from the client’s own closed incidents, and label it as an assumption when you carry it forward. If there aren’t any, walk through one realistic scenario with the client, row by row, and label the result as modeled.
Should I use a data breach cost calculator or an industry report? Use them to start a conversation or to sanity-check the order of magnitude, not as an input to the client’s number. An average describes other companies, and a calculator knows nothing about this client’s margins or contracts. If you quote an outside figure, name the primary source and keep it separate from the client’s own numbers.
Does cyber insurance reduce the cost of an incident? It may, but whether a loss is covered depends on the policy, so don’t assume it. Show the gross cost first. If the insurer has confirmed a payout, you can show a net figure next to the gross one, and name the retention, the part of a covered loss the client bears before the policy pays. Leave coverage questions to the client’s broker or insurer.
Should reputational damage be included in the total? Keep it out of the sum and list it below the total in words. Reputational damage can be serious, but it can’t be stated to the dollar with any confidence. Adding a guess to a figure the client can trace row by row makes the whole total harder to defend when the client’s finance team asks where it came from.
This article is general information on estimating the cost of security incidents. It does not constitute financial, legal, or insurance advice. Example figures are hypothetical and for illustration only. Values in the Mahoney Control Financials module are calculated from the environment, the values set for it, and platform defaults. Risk models are advisory.
Drafted with AI assistance, checked against our platform and website, and reviewed by Mahoney IT. How we write